Get in touch with us today and our team of imaging professionals will be pleased to assist you.
Correlating eSDK Pro with eCapture Pro
This topic shows how a machine-vision inspection system can be implemented using either eCapture Pro or eSDK Pro, with the same plugins and pipeline structure.
The goal is to help developers who are familiar with eCapture Pro understand how a Processing View pipeline maps directly to an eSDK Pro application. Rather than introducing new concepts or APIs, this topic translates existing eCapture Pro workflows into their programmatic equivalents.
This example does not attempt to:
- Teach the eSDK Pro API in full
- Explain how to write plugins from scratch
- Describe AI models, training workflows, or hardware configuration details
Instead, it focuses on correlation: how the same system behaves identically in both environments, with only the orchestration mechanism changing.
Example System Overview
This section describes the physical inspection system and signal flow used throughout this example. Understanding the system context makes it easier to see how the same pipeline is represented in both eCapture Pro and eSDK Pro.
Physical Inspection System Used in This Example
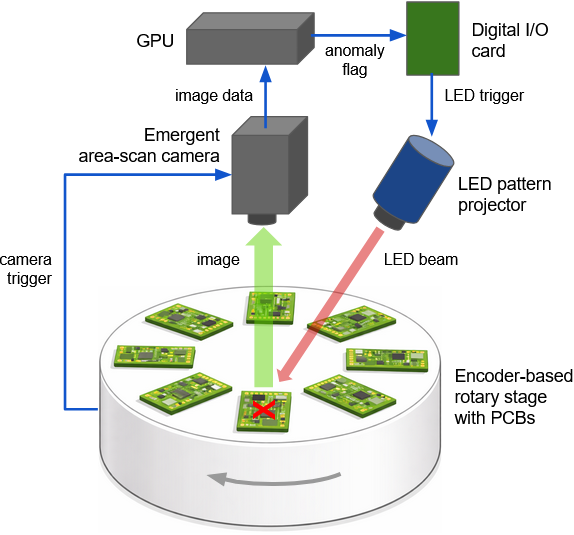
Figure 1: Physical layout of the inspection system
The example system performs high-speed inspection of printed circuit boards (PCBs) mounted on a rotating turntable. The physical system consists of:
- A Zaber Technologies encoder-based rotary stage with an integrated turntable holding an array of eight PCBs
- A high-speed area-scan camera from Emergent Vision Technologies
- A GPU-equipped server hosting the image processing pipeline, using an NVIDIA GPU and an Advantech digital I/O PCIE card
- An LED pattern projector from Opto Engineering for visual indication of defective boards
The rotary stage provides hardware trigger signals as each PCB enters the inspection position. The camera acquires images on these triggers and streams them to the server for processing.
Functional Signal Flow Through the System
At runtime, the system follows a simple, repeatable flow:
- The encoder-based rotary stage advances the turntable and generates a hardware trigger as each PCB enters the inspection position
- The camera acquires an image of the PCB on each trigger
- The image data is streamed to the GPU-equipped server and processed in the image processing pipeline
- An anomaly detection algorithm evaluates the image
- An anomaly flag is produced indicating whether the PCB is defective
- The anomaly flag is sent to the digital I/O card, which generates an LED trigger to activate the LED pattern projector when a defect is detected
This same functional flow is expressed graphically in eCapture Pro and programmatically in eSDK Pro.
How This Example System Appears in eCapture Pro
In eCapture Pro, the system is represented using two views:
- The System View, which shows the camera, network interface, server, and GPU
- The Processing View, which shows the pipeline of processing blocks and their connections
The Processing View is the primary reference for understanding how this system maps to eSDK Pro code.
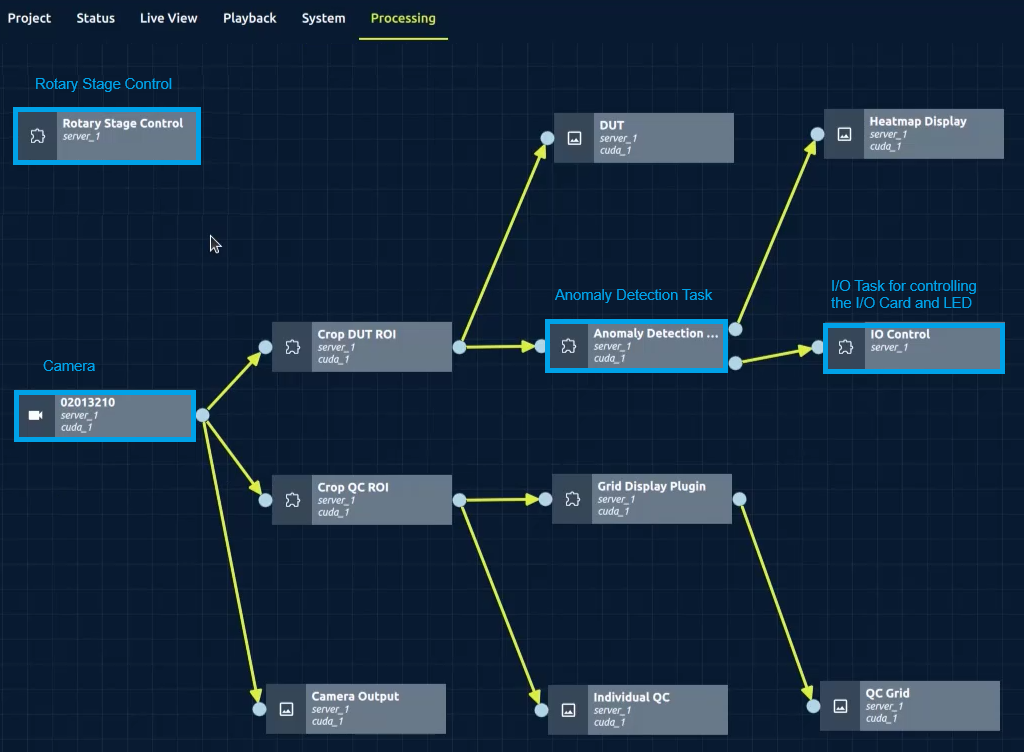
Figure 2: eCapture Pro Processing View showing the inspection pipeline annotated to highlight the camera and plugins
Custom Plugins Used by Both eCapture Pro and eSDK Pro
The example system uses three custom plugins. Each plugin is compiled once and reused in both environments:
- In eCapture Pro, the plugin is loaded as a DLL and appears as a drag-and-drop block
- In eSDK Pro, the same plugin DLL is instantiated programmatically as a pipeline task
In both cases, plugin behavior is governed by the pipeline lifecycle.
ZaberControlTask Plugin: Rotary Stage Control
The ZaberControlTask plugin is responsible for configuring and operating the encoder-based rotary stage that drives PCB motion and camera triggering.
Because the ZaberControlTask operates independently of image or data flow, it does not require explicit task connections.
In eCapture Pro, this plugin appears as a processing block in the Processing View. In an eSDK Pro application, the same compiled plugin is instantiated as a pipeline task. In both environments, execution is driven by the pipeline lifecycle, while runtime behavior may also be influenced by parameters or upstream data.
When the pipeline is started, the plugin’s Init() method is called. As shown in the sample code, this is where the rotary stage is initialized: the serial connection is opened, the device is homed, hardware triggering is configured, and turntable motion is started. Most of the functional work for this plugin happens during initialization rather than during continuous processing.
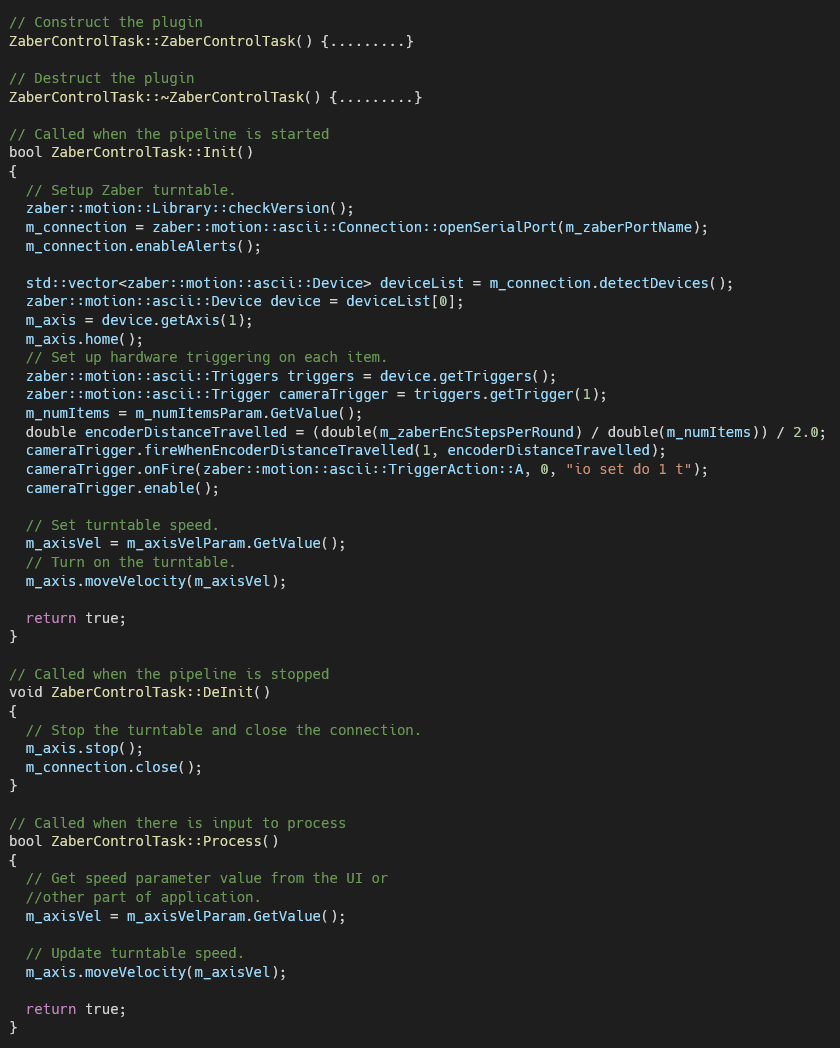
Figure 3: ZaberControlTask plugin lifecycle and initialization code
While the pipeline is running, the Process() method executes only as needed to apply runtime updates, such as changes to turntable speed. When the pipeline is stopped, DeInit() is called to stop motion and close the hardware connection cleanly.
This lifecycle-driven behavior is identical in eCapture Pro and eSDK Pro. The difference lies only in how the pipeline is created and started, not in how the plugin itself operates.
AnomalyDetectionTask Plugin: Defect Detection Logic
The AnomalyDetectionTask plugin analyzes each acquired image and determines whether the PCB under inspection contains a defect.
As with the ZaberControlTask plugin, the same compiled plugin is used in both eCapture Pro and eSDK Pro. In this case, the plugin participates directly in the image-processing data flow, receiving image frames from upstream tasks.
When the pipeline is started, the plugin’s Init() method is called. Any required setup—such as preparing the inference model or allocating internal resources—occurs at this stage (model details are outside the scope of this example).
While the pipeline is running, the Process() method is invoked whenever an input frame is available. As shown in the sample code, the plugin retrieves the incoming image frame, runs the anomaly detection algorithm, and evaluates the result. Rather than triggering hardware actions directly, the plugin produces a simple output flag indicating whether the PCB is anomalous. This data is passed downstream to other pipeline tasks.
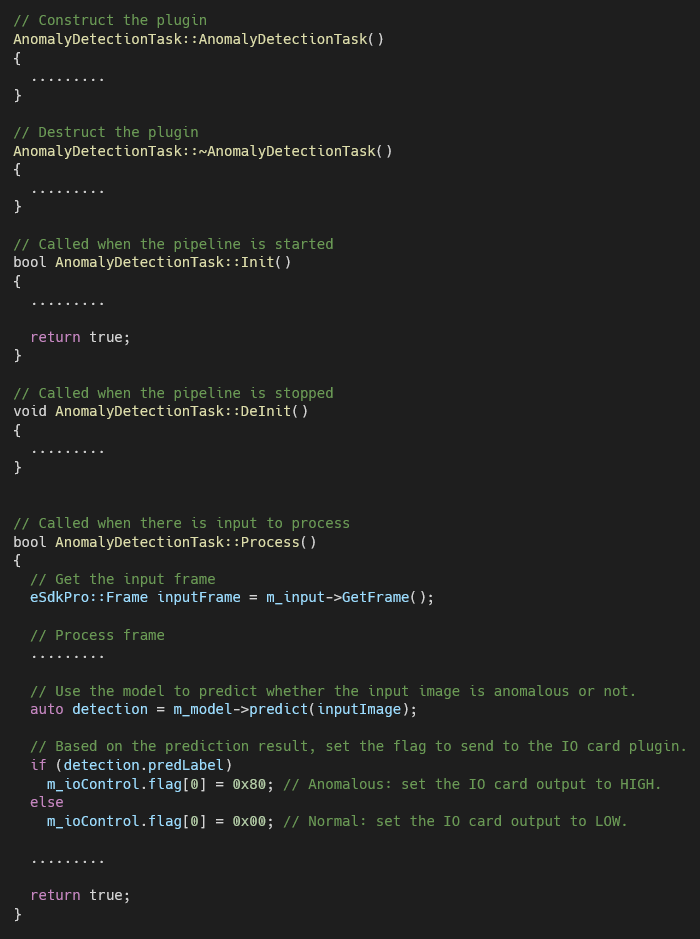
Figure 4: AnomalyDetectionTask plugin image-processing and decision logic
When the pipeline is stopped, the DeInit() method releases resources and returns the plugin to a clean state.
This separation of responsibilities is intentional. The anomaly detection plugin focuses solely on image analysis and decision-making, while downstream plugins handle physical actions. The same separation exists in both eCapture Pro and eSDK Pro.
AdvantechControlTask Plugin: IO and LED Control
The AdvantechControlTask plugin converts anomaly detection results into a physical action by controlling the external IO card and LED indicator.
Like the anomaly detection plugin, this task uses the same compiled plugin in both environments. Unlike image-processing tasks, it operates on data produced upstream rather than image frames.
When the pipeline is started, the plugin’s Init() method prepares the IO interface and any required hardware resources. During pipeline execution, the Process() method is invoked whenever new data arrives from the anomaly detection plugin.
As shown in the sample code, the plugin reads the anomaly flag produced upstream and determines whether an LED pulse should be generated. If a defect is detected, the plugin sends a timed digital output pulse to the IO card, which drives the LED to illuminate the defective PCB. The low-level details of pulse generation are encapsulated within the plugin.
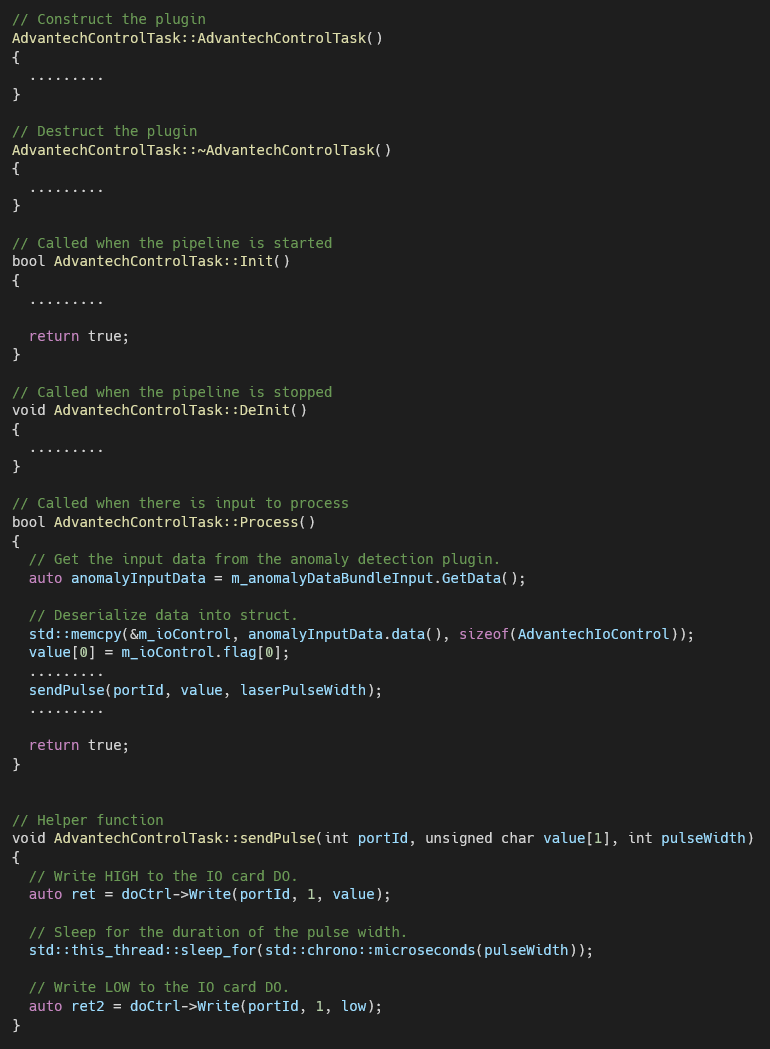
Figure 5: AdvantechControlTask plugin IO control and LED trigger logic
When the pipeline is stopped, the DeInit() method returns the IO hardware to a known, inactive state.
This design reinforces a clear separation between decision-making and physical control, and it behaves identically in both eCapture Pro and eSDK Pro.
Pipeline Creation and Execution: eCapture Pro vs. eSDK Pro
This section shows how the same inspection pipeline is assembled and executed in eCapture Pro and in an eSDK Pro application.
The intent is not to document every API call, but to make the correspondence between Processing View blocks and pipeline code explicit.
Processing View Pipeline in eCapture Pro
In eCapture Pro, the pipeline is created visually in the Processing View by dragging blocks onto the canvas and connecting them to define execution order and data flow.
In this example, the Processing View includes:
- A camera block that produces image frames
- ROI and image preparation blocks
- The AnomalyDetectionTask block
- The AdvantechControlTask block
- Display blocks for visualizing results
Starting the pipeline initializes all plugins by invoking their Init() methods, begins image acquisition, and runs the processing graph continuously until the pipeline is stopped.
Equivalent Pipeline Code in an eSDK Pro Application
In an eSDK Pro application, the same pipeline is created programmatically using the eSDK Pro API.
As shown in the sample code from the example, the application:
- Creates a system instance
- Retrieves a pipeline object
- Creates task instances for the camera and each plugin
- Connects task outputs to task inputs explicitly
- Starts and stops the pipeline under application control
Each call to CreateCameraTask() or CreatePluginTask() corresponds directly to a block in the eCapture Pro Processing View. Each call to ConnectTasks() corresponds to a visual connection between blocks.
The structure and execution order of the code mirrors the structure of the Processing View graph.
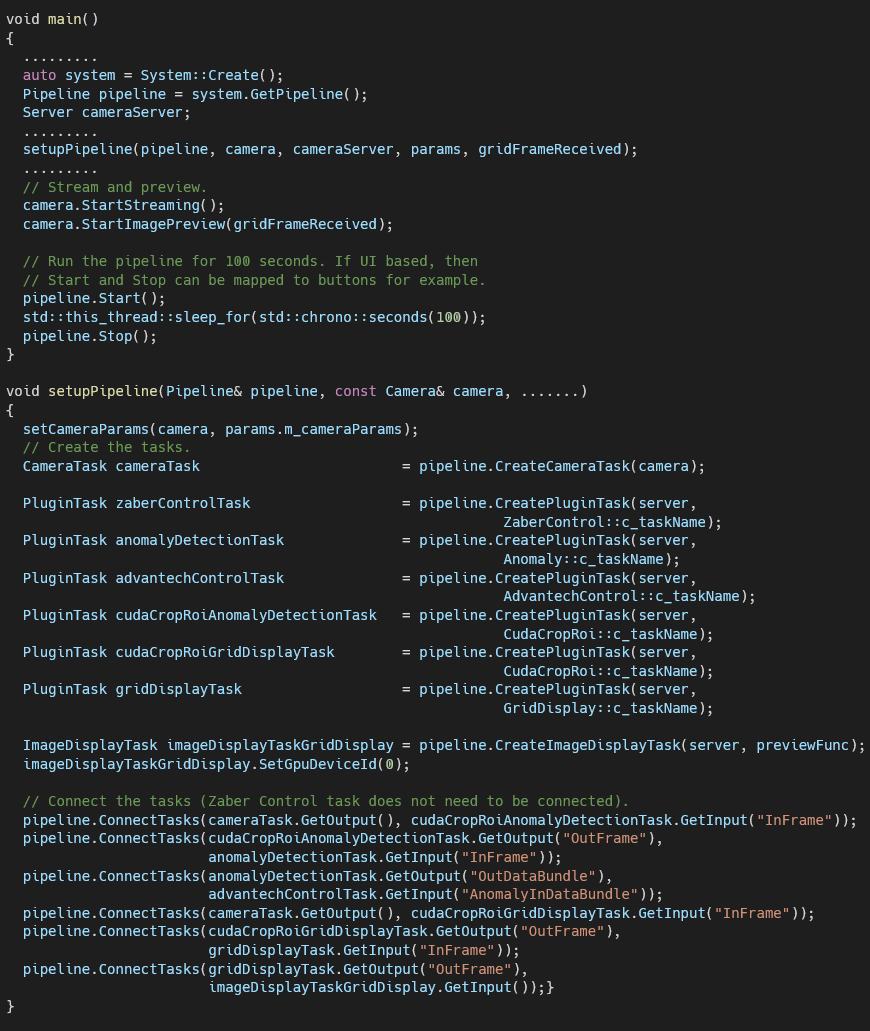
Figure 6: eSDK Pro application code for pipeline creation and task connections
Mapping Processing View Blocks to Pipeline Tasks
The mapping between eCapture Pro and eSDK Pro is one-to-one:
- A camera block maps to a
CameraTask - A plugin block maps to a
PluginTaskinstantiated from the same compiled plugin - A display block maps to a display task
No additional behavior is introduced in code. The pipeline makes explicit what the Processing View represents visually.
Mapping Processing View Connections to ConnectTasks Calls
In eCapture Pro, connecting two blocks defines how data flows between them. In eSDK Pro, the same relationship is expressed using ConnectTasks() calls that bind a task output port to another task input port.
For example:
- Image frames flow from the camera task to ROI and anomaly detection tasks
- Detection results flow from the anomaly detection task to the IO control task
The direction and order of these connections determine execution order, just as they do in the Processing View.
Starting and Stopping the Pipeline
Pipeline execution maps directly between the two environments:
- Clicking Start Pipeline in eCapture Pro initializes and starts the pipeline
- Calling
pipeline.Start()in eSDK Pro performs the same operation
Similarly:
- Clicking Stop Pipeline in eCapture Pro
- Calling
pipeline.Stop()in eSDK Pro
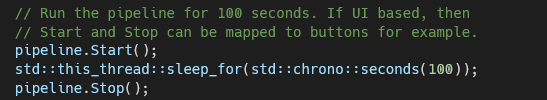
Figure 7: eSDK Pro pipeline start and stop control code
Both actions invoke the same plugin lifecycle methods (Init, Process, DeInit) on the same plugins. Only the orchestration mechanism differs.
Summary
This example demonstrates that eCapture Pro and eSDK Pro share the same execution model:
- The Processing View is a visual representation of the pipeline
- The pipeline code is a programmatic representation of the same graph
- Plugins behave identically in both environments
- Only the method of pipeline creation and control changes
With this understanding, developers can prototype systems rapidly in eCapture Pro and then implement the same systems programmatically using eSDK Pro, without redesigning pipelines or rewriting plugins.
See Also
- Uploading Custom Plugins to eCapture Pro
- eSDK Pro Programmer’s Guide Overview
- Using eSDK Pro Examples
- eSDK Pro How-To Guides
Get in touch with us today and our team of imaging professionals will be pleased to assist you.