Get in touch with us today and our team of imaging professionals will be pleased to assist you.
Quick Start Guide: Basic eCapture Pro Usage
After you install eCapture Pro, use this topic to verify that it works by adding the local server, the NIC, and the camera to the System view graph, and then viewing images from the camera in Live View.
Who this is for
System integrators and developers who want to verify that eCapture Pro works by connecting to a camera and viewing images.
What you’ll accomplish
- Start eCapture Pro.
- Add the local server, NIC, and camera in the System view.
- View images in Live View.
- Confirm that eCapture Pro is ready for basic camera validation.
Before you begin
- Complete Software Installation.
- Ensure that no other application is using the camera.
Important: Do not run eCapture Pro and eSDK Pro or classic eSDK at the same time on the same server.
Procedure 1: Start eCapture Pro
- Start eCapture Pro.
- Windows: Double-click the eCapture Pro desktop icon. Or run
eCapturePro.cmd(typicallyC:\Program Files\EVT\eCapturePro). - Linux: Launch eCapture Pro from your applications list. Or run
eCapturePro.sh(typically/opt/EVT/eCapturePro/).
- Windows: Double-click the eCapture Pro desktop icon. Or run
- If eCapture Pro opens the license screen (figure 1), select Trial to open the main window (figure 2).
Verify success: You see the eCapture Pro main window.
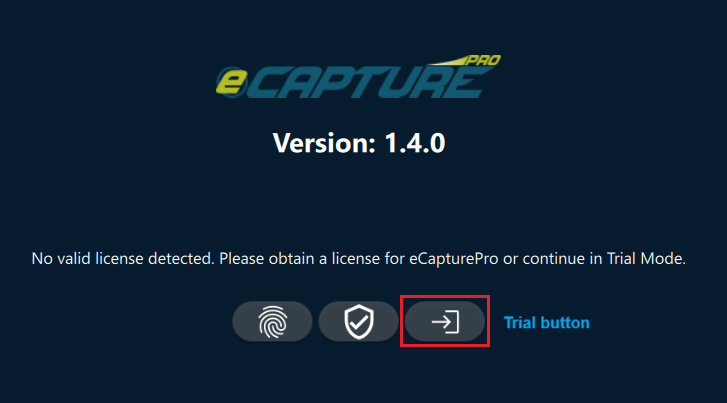
Figure 1: eCapture Pro license screen
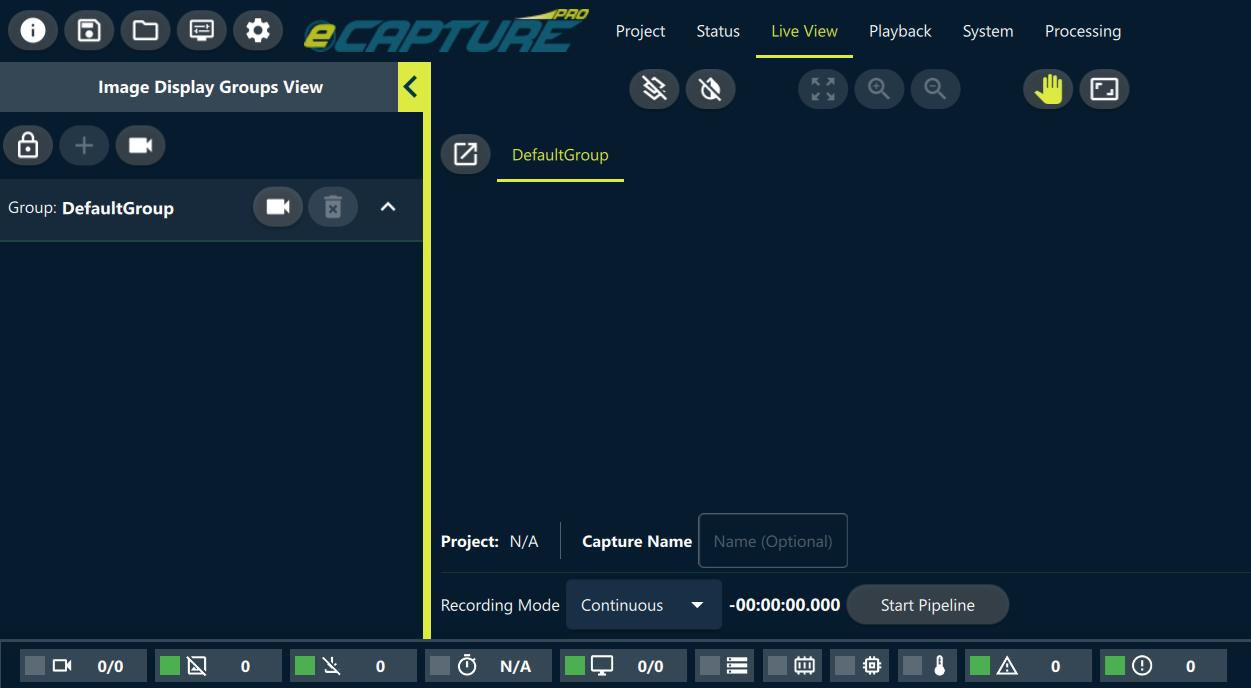
Figure 2: eCapture Pro main window with the System tab open
Procedure 2: Configure hardware in the System view
Use the System view to add the local server, NIC, and camera to the system graph.
- Select the System tab to open the System view.
- Add the local server.
- In System Actions, select the house icon to add a local server.
- In the local server dialog, confirm the IP Address and Port Number values, and then select the check mark icon.
- Add the NIC that is physically connected to the camera.
- Select the server node in the graph.
- In Selected Nodes, under Add network interface, select + beside the NIC that is physically connected to the camera.
- Add the camera that is physically connected to that NIC.
- Select the server node in the graph.
- In Selected Nodes, under Add camera, select + beside the camera that is physically connected to the NIC shown in the graph.
- If the camera does not connect automatically to the NIC in the graph, remove that camera node and add the camera that is physically connected to the NIC shown in the graph.
- Recommended: auto-configure the NIC and camera networking.
- Select the server node in the graph.
- In Selected Nodes, select the gear icon.
- In the server setttings dialog, select Auto re-configure interface + cameras IPs.
- In the confirmation dialog, select OK.
Verify success: The camera, NIC, and server nodes appear connected in the graph as camera → NIC → server (figure 3).
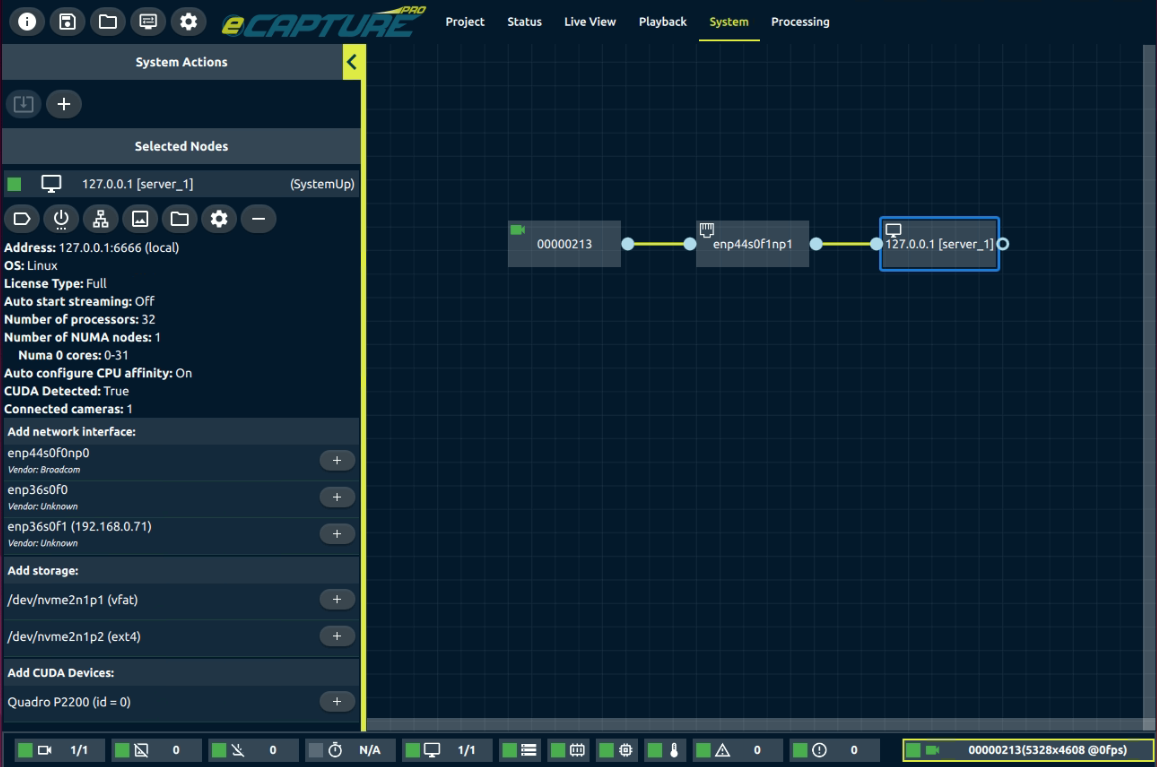
Figure 3: The System view with connected hardware nodes and selected node settings
Procedure 3: View live images in Live View
Live View shows the cameras that you added in the System view. You can view a camera preview whether or not a pipeline is running.
Important: Live View shows a reduced-resolution preview image to keep the UI responsive.
- Select the Live View tab.
- If the camera stream tile shows Streaming Disabled, right-click the camera stream tile, and then select Camera Stream settings > Stream and display.
- Optional: Adjust camera settings to improve the preview image.
- Select the camera stream tile.
- In the parameters panel on the right, adjust settings such as Exposure and Frame Rate if needed.
Verify success: The camera stream tile shows a live preview image instead of Streaming Disabled (figure 4).
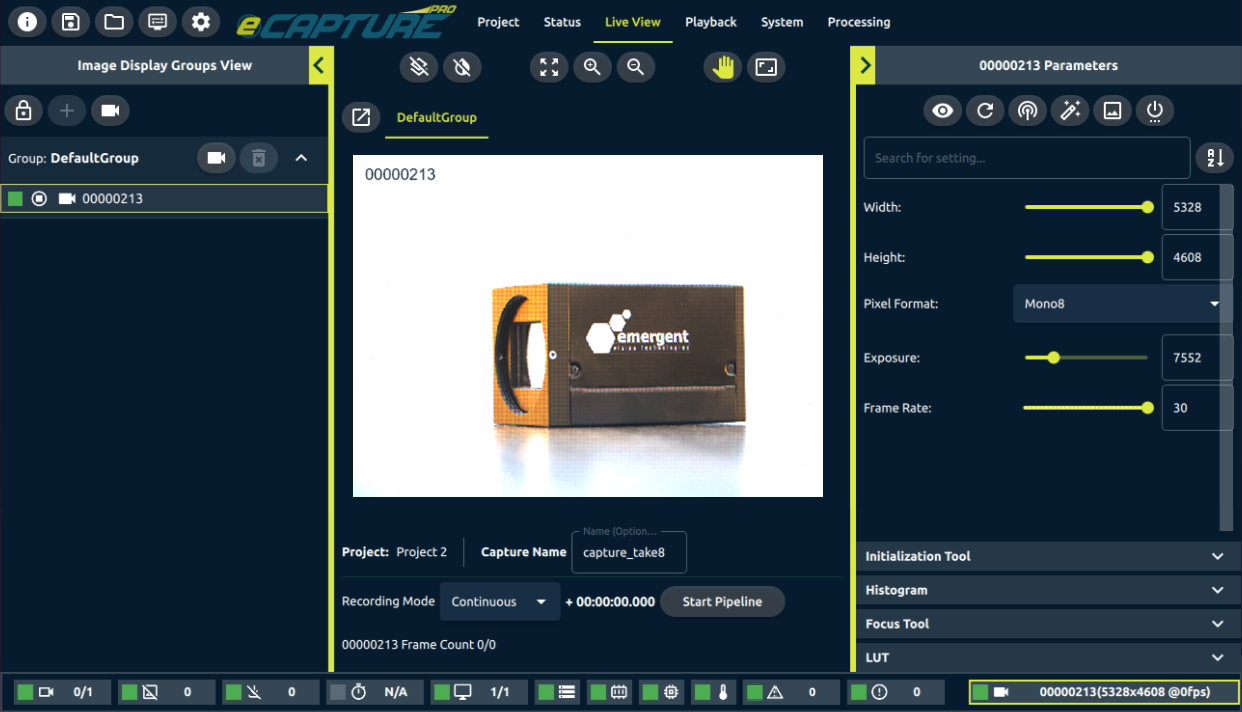
Figure 4: Live View with a live camera preview and camera settings in the parameters panel
Optional procedure: Validate a one-task pipeline
This procedure is optional. You do not need a pipeline to complete the basic eCapture Pro validation path. Use this procedure only if you want to validate a one-task pipeline by using the Image Display image processing task.
- Select the Processing tab to open the Processing view.
- In the Server list in the left panel, select the local server.
- Under Add Processing Tasks, select + beside Image Display.
- In the graph, connect the camera node to the Image Display node (figure 5).
- Select the Live View tab, and then select the Start Pipeline button.
Verify success: The Image Display tile shows images while the pipeline runs (figure 6).
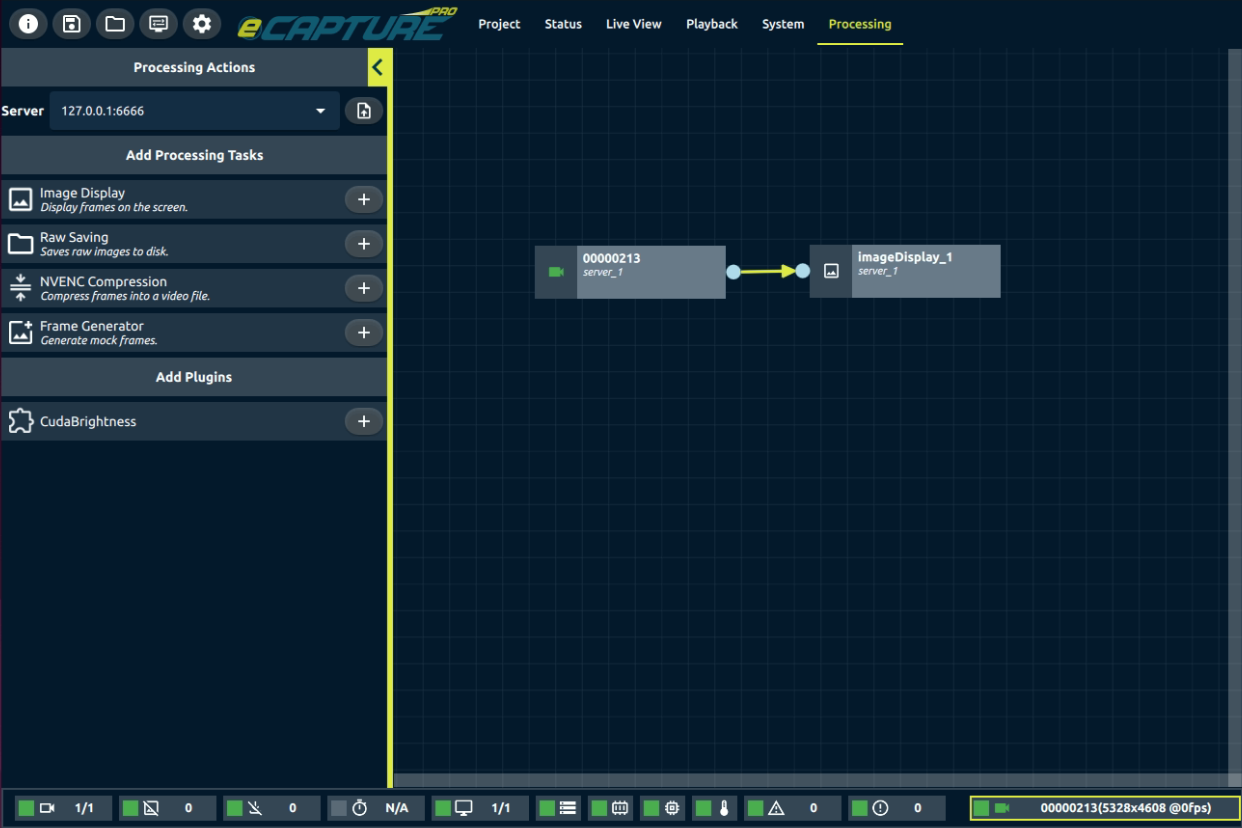
Figure 5: The Processing view with the camera node connected to the Image Display node
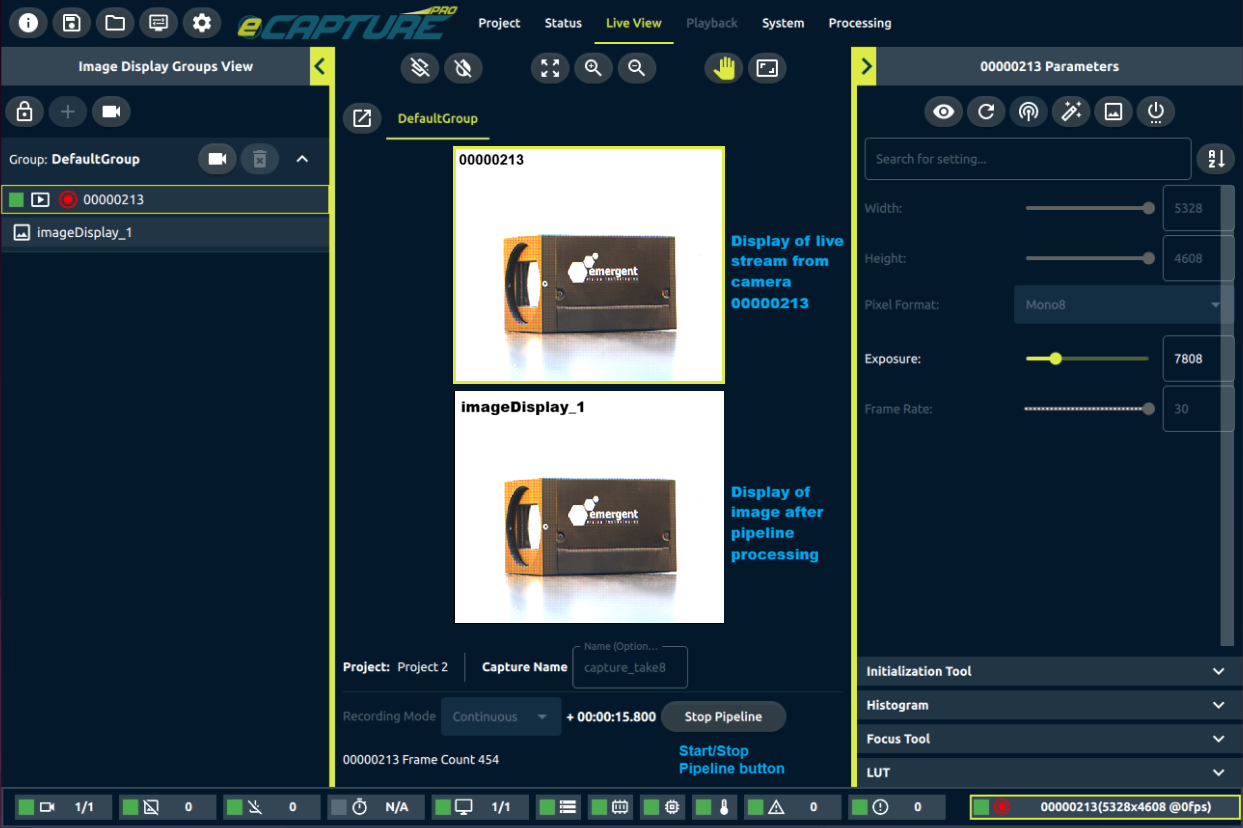
Figure 6: Live View with the camera stream tile and the Image Display tile while the pipeline runs
Optional next steps
After you verify that eCapture Pro works, you can continue with one of these topics:
- To verify that eSDK Pro works by running a code example, go to eSDK Pro Code Examples.
- To see how camera settings in eCapture Pro, such as Exposure and Frame Rate, map to camera parameters in code, go to Correlating eSDK Pro with eCapture Pro.
Get in touch with us today and our team of imaging professionals will be pleased to assist you.