Get in touch with us today and our team of imaging professionals will be pleased to assist you.
The eCapture Pro System View
The System View in eCapture Pro is where you add, connect, and configure servers, network interfaces, and cameras.
Configure the system graph before you use Live View or Processing View.
System View includes two panels:
- Actions Panel: Located on the left.
- Graph Panel: Located on the right.
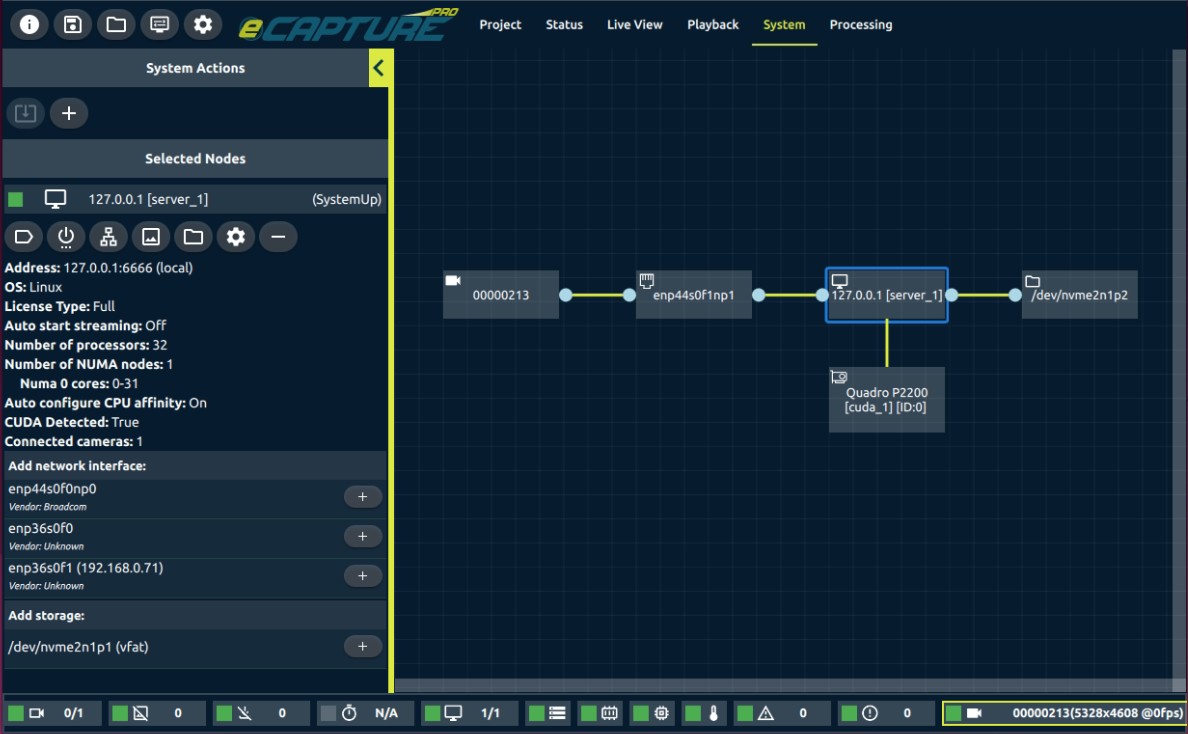
Figure 1: System View with a server node selected in the Graph Panel and its details shown in the Actions Panel.
Actions Panel
Use the Actions Panel to add hardware and configure selected nodes.
System Actions
The System Actions section lets you add a server to the graph. The local server represents the computer where the eCapture Pro application is installed and running.
Selected Nodes
The Selected Nodes section shows information, settings, and available actions for the node or nodes selected in the Graph Panel. The content changes based on the selected node. For example, when you select a server node, Selected Nodes can show server details and actions such as adding network interfaces or storage.
Graph Panel
Use the Graph Panel to view, select, and connect hardware in the system graph and verify that the system is configured correctly.
Select a node to view or modify its settings in the Actions Panel.
See Also
For information about other views, the Global Toolbar, and the Global Status Bar, see eCapture Pro User Interface Overview.
Get in touch with us today and our team of imaging professionals will be pleased to assist you.